Investigating Weather with Google Earth
Students will use Google Earth to explore some factors that affect weather. They will use Google Earth to determine how latitude, elevation, proximity to bodies of water, and mountain ranges affect a location’s climate. They will also explore, analyze, and interpret weather patterns in 7 different U.S. cities.

Implementation Suggestion:
- Some students may not be familiar with interpreting metric values for temperature (in Celsius) and precipitation (in cm) or interpreting climatographs. You may wish to present the Weather and Climate PowerPoint slideshow file to help students comprehend metric values. In addition, this PowerPoint file provides content background material for interpreting climatographs.
- Some students may not be familiar with interpreting metric values for temperature (in Celsius) and precipitation (in cm) or interpreting climatographs. You may wish to present the Weather and Climate PowerPoint slideshow file to help students comprehend metric values. In addition, this PowerPoint file provides content background material for interpreting climatographs.
1. Inform students that they will use climatographs in Google Earth to explore annual temperature patterns in 7 different U.S. cities.
2. Distribute the Investigating Weather with Google Earth Student Guide to each student.
3. Use an LCD projector to display Google Earth at the front of the room.
4. If needed, provide a brief orientation of the Google Earth layout and navigational tool set.
5. Instruct students to download the Investigating Weather.kmz file and view the file in Google Earth.
6. Instruct the students to turn on the Google Earth Gridlines if they are not activated.
7. Show students how to navigate from one city location to the next.
8. Guide students to examine annual weather data from the Philadelphia climatograph. Display the Philadelphia climatograph in the 3D viewer. Show students how to read and interpret the climatograph. Note that “months” are located on the x-axis, “temperature in degrees Celsius” is located on the right y-axis, and “precipitation in centimeters” is listed on the left y-axis. The average monthly temperature is noted by the red points on the graph. The average monthly precipitation is noted by the blue bars on the graph. Ask students what pattern they observe in the climatograph’s temperature data. The climatograph displays a seasonal pattern with lower temperatures during the winter months and higher temperatures during the summer months. Average annual temperatures increase during the spring months and decrease during the fall months. There is a 26 degree Celsius temperature difference between Philadelphia’s lowest and highest average monthly temperatures. This is reflected in the bell shape of the graph with the top of the bell at the temperature peak.
Note: You may need to explicitly state to your students which months correspond to a particular season.
Winter = December, January, and February
Spring = March, April, and May
Summer = June, July, and August
Fall = September, October, and November
Next, ask students what pattern they observe in the climatograph’s precipitation data. In the Philadelphia climatograph, the precipitation is about the same throughout the year. Philadelphia receives an average of 107 cm of annual precipitation or about 9 cm a month, the approximate height of the monthly bar graphs.
Implementation Suggestion:
- Before proceeding with the exploration tasks, some students may need you to model how to compare climatographs from different geographical areas. You may wish to show students the San Diego climatograph and compare its weather patterns to those of Philadelphia. Ask students what pattern they observe in the San Diego climatograph’s temperature data. The climatograph displays a gradual increase in temperature from January to a peak temperature in August. The temperature decreases from August to January. The average annual temperature decreases from August to January. There is only a 7 degree Celsius (14 degree Fahrenheit) temperature difference between San Diego’s lowest and highest average monthly temperatures. Next, ask students what pattern they observe in the climatograph’s precipitation data. Overall, there is very little annual precipitation in San Diego (less than 27.3 cm). San Diego receives almost no precipitation between May and September. Most precipitation occurs between October and April.
9. Distribute the Investigating Weather Student Exploration Sheet to each student. Tell students that they will analyze climatographs from 7 different U.S. cities in order to complete a series of data tables and answer analysis questions. For each city, they will record weather (both temperature and precipitation) patterns based on a seasonal cycle. They will also note the season(s) in which temperature and precipitation peaks occur.
10. Instruct students to analyze the climatographs from the other cities as described in their Student Guide and complete the corresponding data tables and analysis questions.
Implementation Suggestion:
- Some students, especially those that are low-ability level students, students with disabilities, and language learners, may require additional support for completing this learning task. You may wish to walk your students through each city one at a time as an entire class using guided questions to analyze each city’s climatograph. This instructional strategy is effective using one computer in the classroom that displays the image to the front of the room.
11. Review and discuss student responses to key questions.
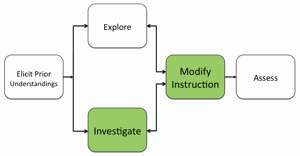
12. If students at the completion of the activity do not understand that latitude, elevation, proximity to bodies of water, and mountain ranges may affect a location’s climate, modify instruction as needed to ensure learner understandings.
Materials Needed:
Materials Needed:
Handouts
(1) Investigating Weather with Google Earth Teacher Guide (PDF / MS Word)
(2) Investigating Weather with Google Earth Student Guide (PDF / MS Word)
(3) Investigating Weather with Google Earth Exploration Sheet (PDF / MS Word)
KML files
PowerPoint File
Assessment Information
Investigating Weather with Google Earth Assessment (PDF / MS Word)
Supplemental Homework Readings for Students
How is Precipitation Changing? (PDF)
Has There Been a Change in Extreme Events? (PDF)
Do Projected Changes in Climate Vary from Region to Region? (PDF)
Teacher Resources/Content Support
Weather and Climate - Print Version (PDF)
