What's Hot at the Mall?
Students will investigate how shopping malls change natural environments. Students will study a mall and its immediate surroundings to understand concepts involved in the formation of urban heat islands.

Content Preview: This investigation examines how shopping malls change natural environments. Studying NASA thermal images of a mall and its immediate surroundings introduces students to urban deforestation and to the formation of urban heat islands. Studying malls from an environmental perspective demonstrates the usefulness of geography in daily life and offers opportunities for direct observation and fieldwork. It is important for us to know how human activities influence the environment. Scientists use aerial photos, satellite images, maps, census data, and other information to examine land use changes and the impact they have on the environment. Shopping malls and their surrounding areas provide excellent examples of temperature changes produced when trees and vegetation are replaced by buildings and pavement. There are intended and unintended environmental consequences when a shopping mall is constructed.
- Distribute Briefing Handout and have students read the Background, Objectives, and Procedures.
- Distribute Investigation 2: Log 1 and ask students to consider how the construction of a mall affects the surrounding environment. For example, malls sometimes replace ecosystems such as forests, wetlands, or open grasslands. These ecosystems provide habitats for wildlife and play an important role in pollution control. Have students identify what will happen to the environmental features listed in the Log when a mall is built.
- Instruct students to open the Madison Square Mall.kml file in Google Earth. Display the image in front of the classroom. Explain to students that this is the aerial imagery of the area around the Madison Square Mall area in Huntsville, Alabama. Next, handout What's Hot at the Mall? Explain to students that the image on the handout is a thermal image. In the thermal image, warmer temperatures are represented by lighter shades of gray and white. Cooler temperatures are represented by darker shades. Instruct students to complete the handout.
- After students have completed the handout, display the thermal image at the front of classroom and review student responses. Discuss how heat is absorbed and reradiated more on certain surface materials such as pavement and asphalt when compared to natural wooded areas of trees that release heat over a much longer period of time. Explain this why it feels very hot when you get out of your car on a hot sunny day at the mall and much cooler by a tree.
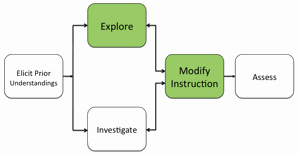
- If students at the completion of the activity do not understand that the different ground surfaces absorb and reradiate heat differently, modify instruction to ensure students understand this concept.
Materials Needed:
Handout
Briefing Handout (PDF) (one copy of each per student)
Investigation 2: Log 1 Handout (PDF) (one copy of each per student)
What's Hot at the Mall? (PDF / MS Word)
Google Earth File
Assessment Information
Investigation 2: Log 1 Assessment (PDF / MS Word)
Handout: What's Hot at the Mall? Assessment (PDF / MS Word)
Supplemental Homework Readings for Students
