Atmospheric Gases
Students will explore the variety and ratio of compounds and elements that make up the Earth’s atmosphere. They will understand volumetric measurements of gases in the atmosphere and visually depict the composition of the atmosphere.

1. Begin the class by asking the driving question: What is our atmosphere made of?
2. Tell students they will investigate the composition of the atmosphere.
3. Distribute a copy of the Atmospheric Gases Student Handout and Atmospheric Composition of Clean Dry Air Activity Sheet to each student.
4. Page 1 of the Student Handout contains background information about concentration measurements. Review this information with your students to ensure that they have an understanding of percentage equivalency and how parts per million (ppm) is represented on the sample graph paper blocks.
5. Page 1 of the Activity Sheet contains a section of graph paper that contains 100 bold grid blocks and 10,000 small blocks. One bold block on the graph paper represents 1% of the volume of the atmospheric composition of clean dry air. Note the Atmospheric Composition box on this page. This box contains the percent of the major atmospheric gases nitrogen, oxygen, argon, and the trace gases.
6. Instruct students to select a different color pencil for nitrogen, oxygen, argon, and the trace gases in the Atmospheric Composition box. Have students fill in the four empty blocks next to each gas name with a different color to create a key for the atmospheric composition graph.
Note: We recommend using color pencils to complete this activity.
7. Instruct students to color one bold grid block for each percentage of the Major Atmospheric Composition gases in the graph paper section. For example, if a gas volume is 1% or 1 part out of 100, the students would color 1 large block on the graph paper. A volume of 1% = 10,000 ppm. If a gas volume is 10% or 10 parts out of 100, they would color 10 large blocks on the graph paper. A volume of 10% = 100,000 ppm.
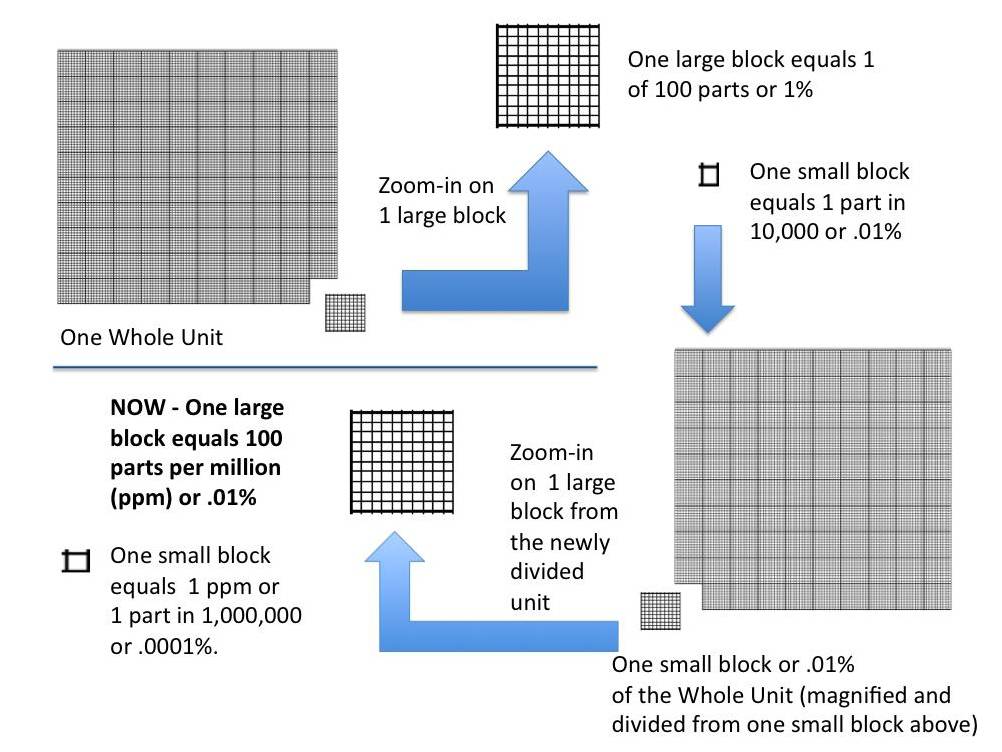
8. It is important for the students to understand that the trace gases are helping to cause global warming. These gases represent an extremely small portion of the atmosphere. This is detailed in the diagram below. The first page of the student handout represents the total atmosphere. The second page of the student handout scales one box from the first page up so that students can understand the role that trace gases play in the Earth's atmosphere.
Implementation Suggestion:
- You may wish to display the Earth's Atmospheric Composition graph from the Atmospheric Composition of Clean Dry Air Activity Sheet to the front of the classroom to model how to equate gas volume percentages to the blocks on the graph paper.
Note: If a gas volume is less than 1%, one small block is colored for each .01% of a gas volume. For example if a gas volume is .08%, they would color 8 small blocks on the graph paper. A volume of .08% = 800 ppm.
Implementation Suggestion:
- Some students may have difficulty with decimal units and may require additional instructional support. For such students, instruct them to estimate the volume of nitrogen and oxygen to the nearest whole percentage. Have them first color nitrogen and oxygen on the graph paper. Have students note that only one bold grid box remains. This represents 1% of the atmosphere. Have students note that the remaining box is composed of 100 smaller boxes.
Prompt students to think about which remaining atmospheric gases would occupy the remaining 1% of the atmosphere.
Next, remind students that each smaller box is equivalent to 1 part in 10,000 or 0.01% of a gas volume. Ask students how many smaller boxes would need to be colored for argon (93 smaller boxes). Instruct students to color argon on their graph paper. Next, ask students how many smaller boxes would need to be colored for trace gases (4 smaller boxes). Instruct students to color trace gases on their graph paper.
Implementation Suggestion:
- Before students continue to page 2 of the activity sheet, have students note that the concentration of trace gases represents only a very small amount of the Earth's atmosphere.
9. Instruct students to look at page 2 of the activity sheet. The graph on page 2 is labeled Argon and Trace Gases. This page contains another section of graph paper that contains 100 bold grid blocks. One bold grid block on the graph paper now represents .01% or 100 parts per million of the volume of the Atmospheric Composition of Clean Dry Air. Note the Argon and Trace Gases box on this page. This box contains the parts per million (ppm) concentration values of argon and the other trace gases.
10. Instruct students to select a different color for carbon dioxide, neon, helium, methane, krypton, hydrogen, and nitrous oxide in the Argon and Trace Gases box. They can insert a “\” slash mark for the box next to argon. Have students fill in the empty blocks next to each gas name with a different color. This will serve as a color key for the trace gases that have volumes large enough to depict on the graphical representation.
Important Note:
The students will not select individual colors for carbon monoxide (0.1 ppm), ozone (0.07 ppm), and nitrogen dioxide (0.03 ppm); these concentrations are too small to accurately depict on this graph, they have concentrations in the parts per billion. These are bulleted (•) in the Argon and Trace Gases box.
11. Emphasize to students that the units represented by the blocks on this page have now changed from percentage (parts per hundred) to parts per million. Each square now represents an even smaller portion of the area measured. One large block is 100 parts in one million or 100 ppm or .01%. Each small block is now 1 part in one million or 1 ppm or .0001%.
12. Instruct students to color one bold grid block for each 100 ppm of the trace gases on the graph paper. For example, if a gas volume is 100 ppm, they would color 1 bold grid block on the graph paper. For values less than 100 ppm, students should color in the designated number of the smallest squares on the graph paper.
Note: Two of the trace gases - hydrogen (0.5 ppm) and nitrous oxide (0.5 ppm) - make up 1.0 ppm of Earth's atmosphere. These concentrations are equivalent to one of the smallest squares on the Argon and Trace Gases graph.
Implementation Suggestions:
- You may wish to display the Argon and Trace Gases graph from the Atmospheric Composition of Clean Dry Air Activity Sheet to the front of the classroom to model how to equate gas volume in parts per million to the blocks on the graph paper.
- For students who have difficulty with using decimal numbers, you may wish to have students round gas volumes to the nearest whole ppm value prior to shading in the graph.
13. Instruct students to answer the Analysis Questions on their activity sheet.
14. Tell students that the trace gases carbon dioxide, methane, carbon monoxide, ozone, and nitrous oxide are referred to as greenhouse gases. They are called greenhouse gases because they are involved in the Earth’s natural greenhouse effect that keeps the planet habitable (livable) and ~30˚C warmer than it would be without the atmosphere. Discuss with students that the increase of these trace gas concentrations in the atmosphere has led to an increase in the average annual global temperature.
15. Discuss with students their responses to the 3 Analysis Questions on the activity sheet. Emphasize to students that the trace gases make up a very small part of our atmosphere (.04%).
Materials Needed:
Handouts
(1) Atmospheric Gases Activity Teacher Guide (PDF / MS Word)
(2) Atmospheric Gases Student Handout (PDF / MS Word)
(3) Atmospheric Composition of Clean Dry Air Activity Sheet (PDF / MS Word)
Assessment Information
Atmospheric Composition of Clean Dry Air Assessment (PDF / MS Word)
