In this investigation, students will locate different divergent boundaries and study their history. They will:
- Investigate how tectonic stresses are accommodated at the plate boundary by examining earthquake and fault data and calculating the half-spreading rate of a plate boundary.
- Investigate features of passive margins, areas along divergent boundaries where continental crust becomes oceanic crust.

Important Notes:
- Prior to implementing this learning activity, make sure that students have prerequisite knowledge that plates are composed of both continental crust and oceanic crust and understand the composition of these crust types. Students should also have some content background about passive continental margins and faults. These concepts are explored in more detail in this investigation.
- We recommend that you read the What happens when plates diverge? Teacher Guide prior to implementing this investigation. The Teacher Guide contains additional content and pedagogical support materials that are not described on this Web page.
Note: A video overview of the learning activity is located below in the Teacher Resources/Content Support section of this Web page. This overview shows how to use the GIS for data analysis in the investigation. A second video provides an overview of the Web GIS interface and navigation features. You may wish to show your students these videos as you introduce the learning activity.
Implementation suggestion:
- Prior to beginning this investigation, show your students the Examples of Fault Types PowerPoint file presentation to provide students with additional background about different types of faults.
Suggested Sequence:
1. Begin the class by asking students to respond to the following question in their journals: What happens when plates diverge?
2. Inform students that they will learn to use a GIS to learn about divergent boundaries using earthquakes, age of the ocean floor, marine gravity anomalies, and by dynamically moving around the continents.
3. Use an LCD projector to display the Web GIS to the front of the room. The Web GIS will open to a global view.
4. Distribute the What happens when plates diverge? Student Guide and Investigation Sheet to each student. Instruct students to follow the directions outlined in their guides.
5. Instruct students to go to: /learners/tectonics and click on What happens when plates diverge?
6. In the first step, students will locate the Mid-Atlantic Ridge and the East Pacific Rise on their maps. If needed, provide an orientation of the Web GIS layout and tool features to your students. We recommend that you show students how to zoom-in and zoom-out to a location using the GIS navigation bar in addition to the Map Navigation Tools, how to identify the cursor's geographic location (latitude and longitude), and display data with the Map Layers and Map Legend.
7. Model how to use the Map Layers tab to activate the Earthquakes M > 4.0 (9/08-9/11) layer and how to use the Query Earthquakes tab to select a subset of data from this layer. Students will query “extensional” faults to learn about earthquakes that occur along divergent boundaries.
8. Have students begin the investigation, complete all data charts and answer the questions on their investigation sheets. Provide guidance to students as needed.
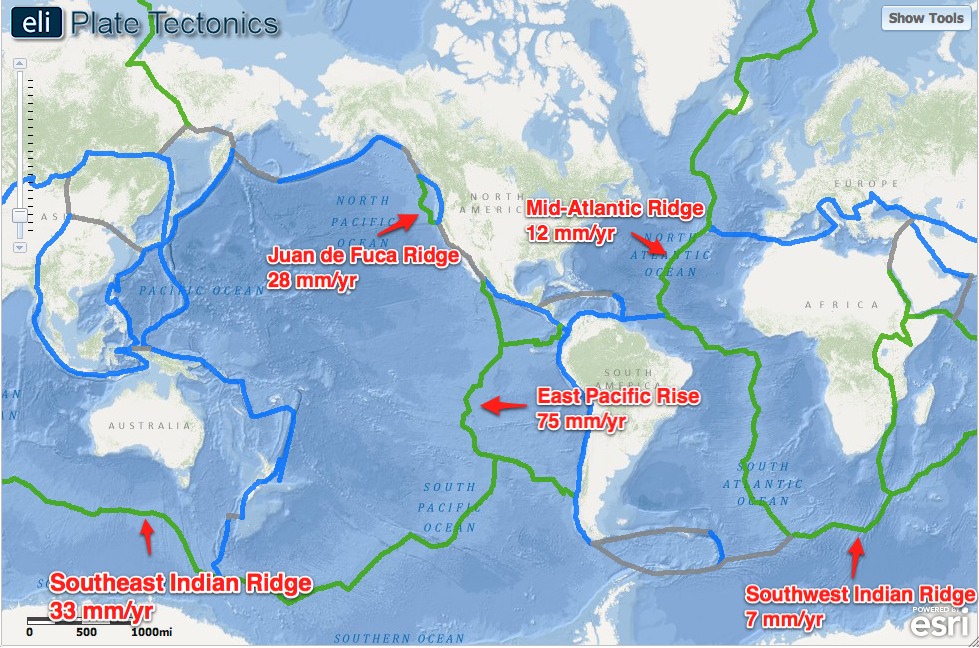
9. In Step 4, students will calculate the rate at which continents are spreading from the divergent boundary. The spreading rate is calculated by dividing the distance between the crust and the plate boundary by the age of the crust. Spreading rates can be presented as a “half spreading rate” -- the rate at which 1 continent is moving away from the divergent plate boundary, or a “full spreading rate” -- the rate at which the ocean basin is opening and 2 continents are spreading away from each other. Students will calculate a half-spreading rate in this investigation. Spreading rates vary at different locations. The image below shows half-spreading rates typical for ridges around the world.

Implementation suggestion:
- Before you begin Step 5, we recommend that you explicitly model to your students how to interpret an elevation profile graph from a profile line drawn on the GIS. Some students may need additional support understanding that all elevations below sea level will be negative numbers, while elevations above sea level will be positive numbers. Sea level is at 0 meters elevation. A deeper sea floor elevation corresponds to a higher negative number. A shallower sea floor elevation corresponds to a lower negative number.
10. Before students start Step 6, make sure they understand what the Marine Gravity Anomaly layer shows. Explain that it is a data set used by geologists to define changes in the density of the crust. To help students think about density, ask them what they think would be heavier, a jar full of ping-pong balls or a jar full of golf balls. A jar full of golf balls is heavier and more dense. A jar full of ping-pong balls is lighter and less dense.
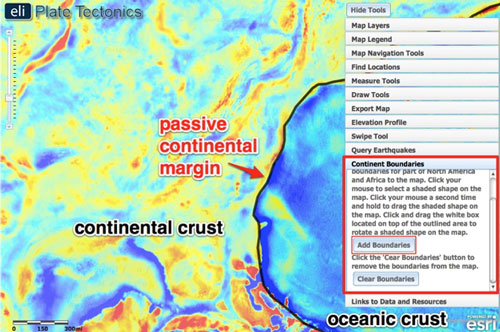
We recommend that you ask students to define the word “anomaly”. Make sure they understand it is a change from the predicted or modeled value. Explain to students that this layer displays changes in gravity (a result of the properties that define continental vs. oceanic crust) as you move across the continental margin and transition from continental crust to oceanic crust. An eotvos is a measure of the gravitational force at that location. Stronger gravitational forces are represented by red-yellow color on the GIS. Weaker gravitational forces are represented by blue-green color. Differences in gravitational forces occur because continental crust and oceanic crust have different compositions and different densities. Oceanic crust is more dense than continental crust. Oceanic crust is mainly composed of basalt and continental crust is mainly composed of granite. A change in gravity occurs across the passive continental margin because the density changes at the transition boundary between continental crust and oceanic crust. This is indicated by locations on the map where red/yellow colors appear next to blue/green colors when the marine gravity anomaly layer is displayed.

Implementation suggestion:
- For classes with students with special needs, you may wish to provide additional modeling, prompts and guidance as students work through the investigation. You may wish to explicitly model each procedural step with the Web GIS using a projected image before the students work independently or in pairs to complete the learning tasks.
11. Review and discuss aloud student responses to key questions on their Investigation Sheets. Ask students if they have any questions about concepts covered in the lesson and respond to their questions.
Implementation suggestion:
- If students have difficulty with answering Question 12, we recommend that you explicitly model how to use the swipe tool with the Marine Gravity Anomaly layer to illustrate that the eastern edge of continental North America is located under water.
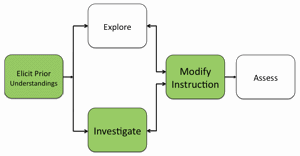
12. At the completion of the activity students should understand that (1) divergent boundaries are marked by shallow earthquakes and high bathymetry, (2) transform faults are located along divergent boundaries, and (3) passive margins form as divergent boundaries open ocean basins as continents spread away. If students do not understand any of these concepts at the completion of the investigation, modify instruction as needed to ensure that students understand these concepts.
13. To provide closure to this investigation, have students reflect on what they have learned about divergent boundaries and discuss their responses. Here are some suggestions:
Provide students with a reflective question to respond in their journals about tectonics. For example:
a) Did South America rift away from the divergent boundary with North America? How can you tell?
b) How are tectonic stresses expressed at divergent boundaries?
c) What is the relationship between transform faults and divergent boundaries?
Materials Needed:
1. Begin the class by asking students to respond to the following question in their journals: What happens when plates diverge?
2. Inform students that they will learn to use a GIS to learn about divergent boundaries using earthquakes, age of the ocean floor, marine gravity anomalies, and by dynamically moving around the continents.
3. Use an LCD projector to display the Web GIS to the front of the room. The Web GIS will open to a global view.
4. Distribute the What happens when plates diverge? Student Guide and Investigation Sheet to each student. Instruct students to follow the directions outlined in their guides.
5. Instruct students to go to: /learners/tectonics and click on What happens when plates diverge?
6. In the first step, students will locate the Mid-Atlantic Ridge and the East Pacific Rise on their maps. If needed, provide an orientation of the Web GIS layout and tool features to your students. We recommend that you show students how to zoom-in and zoom-out to a location using the GIS navigation bar in addition to the Map Navigation Tools, how to identify the cursor's geographic location (latitude and longitude), and display data with the Map Layers and Map Legend.
7. Model how to use the Map Layers tab to activate the Earthquakes M > 4.0 (9/08-9/11) layer and how to use the Query Earthquakes tab to select a subset of data from this layer. Students will query “extensional” faults to learn about earthquakes that occur along divergent boundaries.
8. Have students begin the investigation, complete all data charts and answer the questions on their investigation sheets. Provide guidance to students as needed.
9. In Step 4, students will calculate the rate at which continents are spreading from the divergent boundary. The spreading rate is calculated by dividing the distance between the crust and the plate boundary by the age of the crust. Spreading rates can be presented as a “half spreading rate” -- the rate at which 1 continent is moving away from the divergent plate boundary, or a “full spreading rate” -- the rate at which the ocean basin is opening and 2 continents are spreading away from each other. Students will calculate a half-spreading rate in this investigation. Spreading rates vary at different locations. The image below shows half-spreading rates typical for ridges around the world.

Implementation suggestion:
- Before you begin Step 5, we recommend that you explicitly model to your students how to interpret an elevation profile graph from a profile line drawn on the GIS. Some students may need additional support understanding that all elevations below sea level will be negative numbers, while elevations above sea level will be positive numbers. Sea level is at 0 meters elevation. A deeper sea floor elevation corresponds to a higher negative number. A shallower sea floor elevation corresponds to a lower negative number.
10. Before students start Step 6, make sure they understand what the Marine Gravity Anomaly layer shows. Explain that it is a data set used by geologists to define changes in the density of the crust. To help students think about density, ask them what they think would be heavier, a jar full of ping-pong balls or a jar full of golf balls. A jar full of golf balls is heavier and more dense. A jar full of ping-pong balls is lighter and less dense.
We recommend that you ask students to define the word “anomaly”. Make sure they understand it is a change from the predicted or modeled value. Explain to students that this layer displays changes in gravity (a result of the properties that define continental vs. oceanic crust) as you move across the continental margin and transition from continental crust to oceanic crust. An eotvos is a measure of the gravitational force at that location. Stronger gravitational forces are represented by red-yellow color on the GIS. Weaker gravitational forces are represented by blue-green color. Differences in gravitational forces occur because continental crust and oceanic crust have different compositions and different densities. Oceanic crust is more dense than continental crust. Oceanic crust is mainly composed of basalt and continental crust is mainly composed of granite. A change in gravity occurs across the passive continental margin because the density changes at the transition boundary between continental crust and oceanic crust. This is indicated by locations on the map where red/yellow colors appear next to blue/green colors when the marine gravity anomaly layer is displayed.

Implementation suggestion:
- For classes with students with special needs, you may wish to provide additional modeling, prompts and guidance as students work through the investigation. You may wish to explicitly model each procedural step with the Web GIS using a projected image before the students work independently or in pairs to complete the learning tasks.
11. Review and discuss aloud student responses to key questions on their Investigation Sheets. Ask students if they have any questions about concepts covered in the lesson and respond to their questions.
Implementation suggestion:
- If students have difficulty with answering Question 12, we recommend that you explicitly model how to use the swipe tool with the Marine Gravity Anomaly layer to illustrate that the eastern edge of continental North America is located under water.
12. At the completion of the activity students should understand that (1) divergent boundaries are marked by shallow earthquakes and high bathymetry, (2) transform faults are located along divergent boundaries, and (3) passive margins form as divergent boundaries open ocean basins as continents spread away. If students do not understand any of these concepts at the completion of the investigation, modify instruction as needed to ensure that students understand these concepts.
13. To provide closure to this investigation, have students reflect on what they have learned about divergent boundaries and discuss their responses. Here are some suggestions:
Provide students with a reflective question to respond in their journals about tectonics. For example:
a) Did South America rift away from the divergent boundary with North America? How can you tell?
b) How are tectonic stresses expressed at divergent boundaries?
c) What is the relationship between transform faults and divergent boundaries?
Materials Needed:
Handouts
(1) What happens when plates diverge? Teacher Guide (PDF / MS Word)
(2) What happens when plates diverge? Student Guide (PDF / MS Word)
(3) What happens when plates diverge? Investigation Sheet (PDF / MS Word)
Web GIS
Assessment Information
What happens when plates diverge? Assessment (PDF / MS Word)
PowerPoint File
Examples of Fault Types (PPT)
Teacher Resources/Content Support
Geologic Faults - Print Version (PDF)
Gravity Anomaly - Print Version (PDF)
Web GIS Investigation 4 Tutorial (QuickTime Video)
Web GIS Features Overview (QuickTime Video)
