Carbon Calculator Activity
In this learning activity, students will use a Web-based carbon calculator to determine their carbon footprint. Students will examine their personal and household habits and choices in relation to their carbon footprint; identify which personal activities and household choices produce the most CO2 emissions; compare their carbon footprint to the U.S. and global averages; and identify lifestyle changes they can make to reduce their footprint.
- Begin the class session with the video clip: What is the source of the increased greenhouse gases in the atmosphere?
Note: The video clip is a very large file. You may wish to download the video clip to your computer prior to using it in your classroom.
Carbon Emission Calculator Overview:
The carbon emissions calculator is divided into 3 general areas (Household, Transportation, and Food) that scientists have determined to be main contributors to CO2 emissions at an individual and household level. Each section of the carbon emissions calculator includes questions that will help students understand how much of an impact they are having on the environment. The carbon emissions calculator will determine a student’s carbon footprint based on the answer they provide for each question. Responses to each question will provide a cumulative carbon emission value for each section. At the top of each Web page, students will also see the total cumulative carbon emission value for all sections. Students will be able to view how sensitive each of their responses is to their total annual emissions.
The carbon emissions calculator Web site has 4 tabs across the top - Household, Transportation, Food, and Analysis. Each tab contains a different section of the carbon calculator.
- Beneath the first 3 tabs - Household, Transportation, and Food - are a series of questions that students will answer. Each response produces a corresponding CO2 emissions value.
- After students have completed their responses to all questions in a section, they can use the Next or Previous buttons to move back and forth between the different sections. In addition, students can navigate to a different section, by selecting a tab at the top of the page.
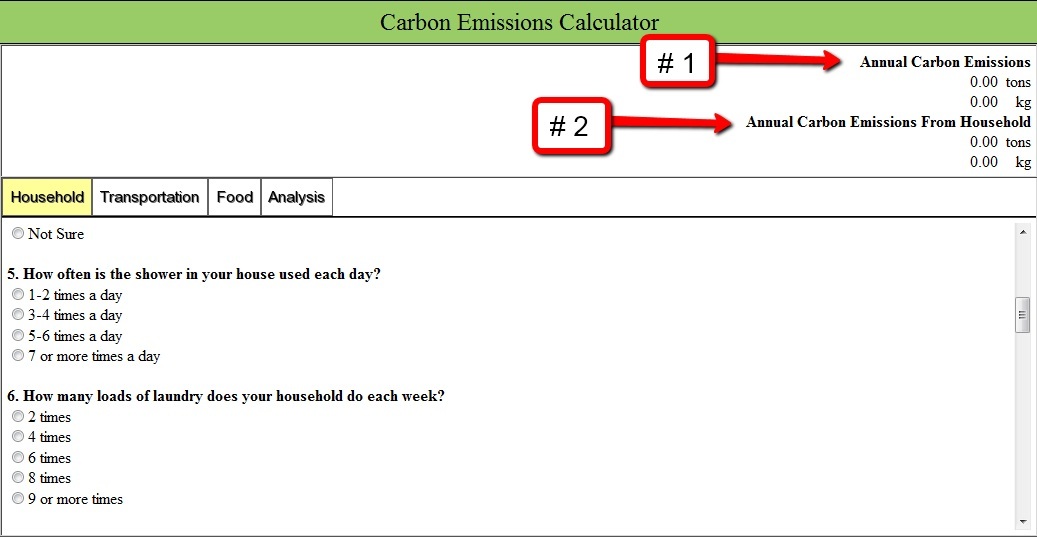
- In the top right corner of the Web page, the calculator displays the total annual amount of CO2 emissions in both tons and kilograms for the displayed section (# 2) and a cumulative total of all 3 sections of the calculator (# 1).
- The calculator will also display the total amount of carbon produced for each student’s response to a question. This is displayed in the Carbon Emission Difference box.
- The Analysis section contains graphical CO2 emissions summaries that are produced based on the students’ responses to each section. Comparison graphs of US and global CO2 emissions are also located in this section of the carbon calculator.
- Show students that they will need to scroll down the page to answer all 18 questions in the Household section.
- Show students how to answer a question by selecting a radial button underneath a question. Show students that they can change their answer by selecting a different radial button.
- A CO2 emissions value is associated with each answer. This value is added to the total emissions for that section and the total annual CO2 emissions.
- To help the students observe how much an activity increases their carbon footprint it will be helpful to show them an example. Have the students navigate to the Transportation tab and scroll down to Question # 2 -How many times a week does your household use a car? The students should select various responses within Question # 2 to observe the magnitude of the tons of CO2 emission changes for each selection.
- After all of the questions are answered in the Household section, students should click on the Transportation tab and answer each question in that section. Students can navigate between pages by selecting the tabs at the top of the page. The students can also navigate to this section by using the Next and Previous buttons at the bottom of the page.
- After all of the questions have been answered on the Transportation tab, instruct students to navigate to the Food tab. Instruct the students to answer all of the questions on this page.
- After answering all questions in the 3 sections, students should navigate to the Analysis section.
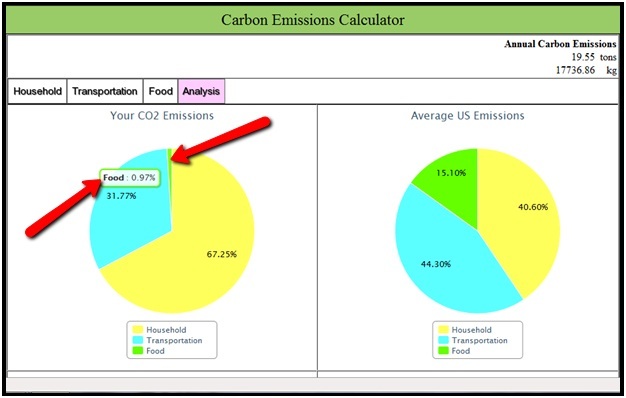
- The Analysis page provides a summary of the students total CO2 emissions and displays their CO2 emissions data for each section. The left pie chart displays the percentage breakdown of the students’ total CO2 emissions by section. Students can also compare their CO2 emissions to the CO2 emissions produced by the average United States citizen.
- If a CO2 emission section is less than 5% of the total, the students will need to scroll their mouse over that section to view the breakdown. See the image below.
- The lower bar graphs display the total CO2 emissions of the student, the average United States citizen (27 tons of CO2 annually), and the average global citizen (5 tons of CO2 annually). This graph is also depicted as kg of CO2.
Implementation Suggestion:
- Some low-ability students may require additional support with reading and interpreting the displayed pie and bar graph data. You may wish to explicitly model how to read and interpret these data displays to assist students with answering the questions on the Student Investigation Sheet. - After reviewing the Analysis page, instruct students to answer the analysis questions on the Student Investigation Sheet.Important Note: The percentage of CO2 emissions from food for middle school students will likely be higher than the percentage of CO2 emissions from food for the average US emissions. This occurs since students’ CO2 emissions percentage from transportation is usually much less than the average US citizens’ emissions percentage.
Materials Needed:
Web Resources
Handouts
Video
What is the source of the increased greenhouse gases in the atmosphere? (Quicktime Movie)
(39 MB) Duration 2:04
Assessment Information
Supplemental Homework Readings for Students
How Do Human Activities Contribute to Climate Change and How Do They Compare with Natural Influences? (PDF)
Teacher Resources/Content Support
Carbon in the Atmosphere - Print Version (PDF)
Carbon Reduction Strategies - Print Version (PDF)