Investigating Climate Hot Spots with Google Earth
Students will use Google Earth to investigate areas affected by climate change.
In this activity, students will use Google Earth to explore several locations where rapid climate change is occurring. They will:
- Use Google Earth to explore 5 hotspot locations indicating recent changes in climate patterns.
- Understand that climate change is not restricted to North America and is happening on a global scale.
- Understand that climate warming has already caused changes in landscape features such as glaciers and organisms’ habitats.
Your students will explore 5 different climate hotspot locations in Google Earth to better understand the effects of climate change. Students will analyze evidence of global climate change and answer analysis questions on their Climate Hotspots with Google Earth Student Investigation Sheet.
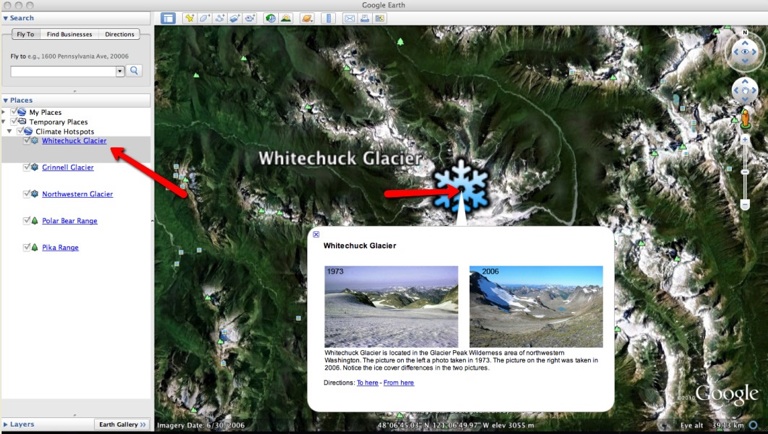
At each location the students should read the text, observe changes in time-sequence images of glaciers, and observe changes in the habitat range maps of polar bears and pikas. Explain to your students that the glacial images were taken at similar locations during two different time periods. This type of photographic evidence helps scientists observe large changes in a landscape over time. Instruct students to answer the analysis questions on their Investigation Sheet.
1. Have the students start by investigating changes in glacial features. These locations are indicated by “snowflake” push-pins. The students should begin by examining the time-sequence images of the Whitechuck Glacier. This is shown in the image below. In these Google Earth displays, the older image of the time-sequence pair will be on the left and a more recent image will be on the right. Instruct students to read the displayed text and observe the differences in the land cover between the two pictures. Have students take note of the years associated with each picture.
2. Next, instruct students to navigate to the Grinnell Glacier location and analyze the differences in the land cover of the two images. Then, they should navigate to the Northwestern Glacier location and observe the land cover changes at that location. Have the students complete the associated table for the 3 glacier locations on their Investigation Sheet. Instruct students to complete Analysis Questions #1-2 on their Investigation Sheet.
3. Instruct students to observe changes in polar bear and pika habitats that have occurred over the last century in North America using the navigation tools in Google Earth.
4. The blue outline indicates the extent of the polar bear habitat range in 1900. The red outline indicates the extent of the polar bear habitat range in 2005. Note to students that the red color is overlaid on top of the blue color. You may need to remind students that polar bears spend most of their time on sea ice.
5. When viewing the Pika Range habitat map, students may need to use the scroll bars in the pop up window to read the associated text underneath the picture.
6. Instruct students to complete Analysis Questions #3-5 on their Investigation Sheet.
Materials Needed:
At each location the students should read the text, observe changes in time-sequence images of glaciers, and observe changes in the habitat range maps of polar bears and pikas. Explain to your students that the glacial images were taken at similar locations during two different time periods. This type of photographic evidence helps scientists observe large changes in a landscape over time. Instruct students to answer the analysis questions on their Investigation Sheet.
1. Have the students start by investigating changes in glacial features. These locations are indicated by “snowflake” push-pins. The students should begin by examining the time-sequence images of the Whitechuck Glacier. This is shown in the image below. In these Google Earth displays, the older image of the time-sequence pair will be on the left and a more recent image will be on the right. Instruct students to read the displayed text and observe the differences in the land cover between the two pictures. Have students take note of the years associated with each picture.
2. Next, instruct students to navigate to the Grinnell Glacier location and analyze the differences in the land cover of the two images. Then, they should navigate to the Northwestern Glacier location and observe the land cover changes at that location. Have the students complete the associated table for the 3 glacier locations on their Investigation Sheet. Instruct students to complete Analysis Questions #1-2 on their Investigation Sheet.
3. Instruct students to observe changes in polar bear and pika habitats that have occurred over the last century in North America using the navigation tools in Google Earth.
4. The blue outline indicates the extent of the polar bear habitat range in 1900. The red outline indicates the extent of the polar bear habitat range in 2005. Note to students that the red color is overlaid on top of the blue color. You may need to remind students that polar bears spend most of their time on sea ice.
5. When viewing the Pika Range habitat map, students may need to use the scroll bars in the pop up window to read the associated text underneath the picture.
6. Instruct students to complete Analysis Questions #3-5 on their Investigation Sheet.
Materials Needed: 
Handouts
(1) Climate Hot Spots with Google Earth Teacher Guide (PDF / MS Word)
(2) Climate Hot Spots with Google Earth Student Handout (PDF / MS Word)
(3) Climate Hot Spots with Google Earth Student Investigation Sheet (PDF / MS Word)
Google Earth File