Investigating Future Worlds with Google Earth (Part 2)
Students will use Google Earth to explore the effects of a 2 meter rise in sea level on the existing landscape. Students will use the Google Earth elevation profile tool to understand the effects of sea level rise in 5 low lying coastal areas and explore changes in sea level in the Chesapeake Bay region.
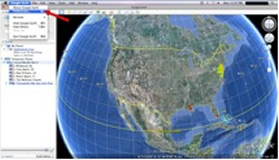
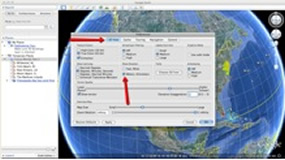
Important Note: Before beginning this activity, make sure that Google Earth is set to metric units. To do this on a Macintosh computer, select Preferences from the Google Earth drop-down menu bar. Click the 3D View tab as shown in the image below. In the dialogue box under Show Elevation, select the check box next to Meters, Kilometers. Then click OK.
To set metric units on a PC computer, go to the Tools menu bar and select Options. Then follow instructions above for the 3D View tab.
Important Note: Students will need to become familiar with using the elevation profile in Google Earth for this investigation. It is important that you model to students how to interpret an elevation profile to ensure that they will be able to interpret changes in land elevation. The Teacher Guide provides detailed instructions.
- Distribute the Investigating Future Worlds with Google Earth (Part 2) Student Guide and Investigation Sheet to each student. Instruct students to follow the directions outlined in their guide.
- Instruct students to go to: /learners/climate-change
Under Future Worlds, students should click on Google Earth file: Future Worlds Part2.kmz.
The file will be displayed in Google Earth. If the file download does not automatically launch Google Earth, double-click on the downloaded file futureworldspart2.kmz to launch Google Earth.
- Show students how to display the red-line path and elevation profile at Wildwood, NJ. Instruct students to navigate to the Wildwood, NJ path by double-clicking on Wildwood, NJ in the Places window. Next, have students click the checkbox to display the red-lined path. Prompt students to press Ctrl+mouse click (Mac) or right click on a PC over the Wildwood, NJ name. In the menu that opens, select Show Elevation Profile.
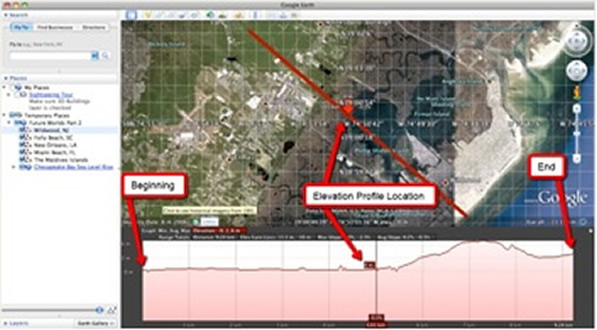
- Instruct students to observe the elevation profile drawn across Wildwood, NJ. The red arrow on the map indicates the location in the profile.
- Assuming that sea level is going to rise 2 meters in the next 100 years, the students should determine the maximum distance inland that the water will travel. Instruct students to determine the furthest distance inland in kilometers (km) that the water would travel if there were a 2 meter rise in sea level. They should record this distance in the data table on their Student Investigation Sheet. Next, instruct students to use Google Earth to determine the type of land cover that this water will cover and record this information on their data table. This may include farmland area, residential area (houses), or marsh areas (low-lying vegetated areas located in coastal areas that are often affected by tides). More than one land cover type can be recorded in the data table. Students may need to zoom in to the landscape with Google Earth to observe the land use type.
Important Note: When finished, students should close the elevation profile box by selecting the “x” in the corner of the Elevation Profile before moving to the next location.
Implementation Suggestion:
- Some students may not be familiar with how to interpret land cover areas using Google Earth. You may wish to explicitly model how to interpret a farmland area, a residential area, and a marsh area in Google Earth.
- The students should then navigate to the four other path line locations in Google Earth (Folly Beach, SC; New Orleans, LA; Homestead, FL; and the Maldives Islands). Similar to the Wildwood, NJ location, they should determine the furthest distance inland in kilometers (km) that the water would travel if there were a 2 meter rise in sea level and determine the type of land cover that would be affected. Instruct students to record this data in the data table in their Student Investigation Sheet.
Implementation Suggestion:
- You may wish to highlight to students that they should locate the first point inland from the shoreline that is 2 meters in elevation. Note to students that if sea level were to rise to a 2-meter level, all the land from the shoreline to that 2-meter elevation location would be under water from rising sea level.
- Instruct students to answer analysis questions # 1-2 on their Student Investigation Sheet.
- Next, instruct students to navigate to the Chesapeake Bay by double clicking on Chesapeake Bay Sea Level Rise in the Places window. Students should read the associated text. When finished, they should select the “x” in the upper corner of the box.
- Tell students they will navigate to 13 different locations in the Chesapeake Bay watershed to determine which areas will succumb to sea level rise in the event that it rises 1 meter or 2 meters. Students can navigate to each city or island by double-clicking on the location name or using the navigation tools to observe that city or island.
Important Note: In the two Chesapeake Bay sea level rise layers, the color blue indicates water. All other colors indicate a form of land.
- Once at a specific city or island location, students should activate the 1 Meter Rise layer by selecting the check box next to that layer to see if that city would be under the water if sea level were to rise 1 meter. Next, the students should uncheck the 1 Meter Rise layer and activate the 2 Meter Rise layer. In this manner, they can navigate to each location and toggle back and forth between the 1 meter and 2 meter rise layers to see which sea level rise scenario would impact a particular location. A city or island is considered underwater if it is mostly covered by blue color.
- Instruct students to record in the data chart on their Investigation Sheet which Sea Level Rise Scenario (1 Meter Rise or 2 Meter Rise) would place a location under water.
- Instruct students to answer analysis questions #3-6 on their Investigation Sheet.
- Review student responses to the questions on the Investigation Sheet. If students do not understand that sea level rise can be most likely attributed to sea ice sheets that has been melting at faster rates over the last several decades due to increased surface temperatures, modify instruction as needed to ensure that students understand this concept.
Materials Needed:
Handouts
Google Earth File
Assessment Information
Supplemental Homework Readings for Students
Is Sea Level Rising? (PDF)
How Reliable are the Models used to Predict Future Climate Change? (PDF)
Are Extreme Events, Like Heat Waves, Droughts, or Floods Expected to Change as the Earth's Climate Changes? (PDF)
How Likely are Major or Abrupt Climate Changes Such as Loss of Ice Sheets or Changes in Global Ocean Circulation Occurring? (PDF)
If Emissions of Greenhouse Gases are Reduced, How Quickly do Their Concentrations in the Atmosphere Decrease? (PDF)
Teacher Resources/Content Support
Carbon Reduction Strategies - Print Version (PDF)
Intergovernmental Panel on Climate Change (IPCC) Fourth Assessment Report (AR4) (PDF)